
Monte Carlo sprint forecast on your Azure DevOps dashboard, free
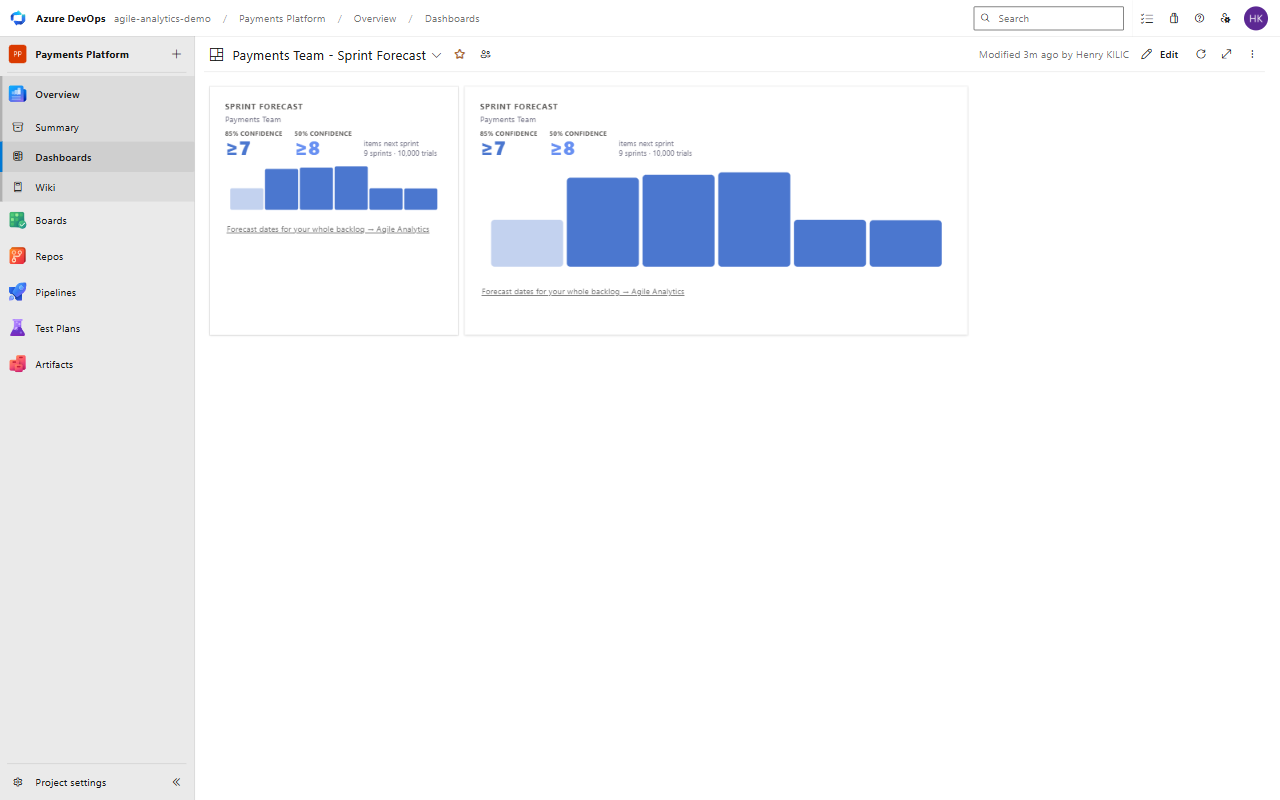
Monte Carlo Sprint Forecast adds one tile to your Azure DevOps dashboard. It answers a single planning question: how many work items will this team finish next sprint? The tile shows two numbers, at 85% and at 50% confidence, with the distribution of outcomes behind them. The forecast is built from your own team's delivery history, not from a story point estimate or an assumed velocity. What the tile shows
How it worksThe extension reads how many items your team finished in each of its most recent completed sprints (up to twelve, not counting the sprint in progress), then runs 10,000 simulated sprints by repeatedly sampling from that history. The 85% and 50% figures are read from the results. The more consistent your recent delivery, the narrower the range. If a team has no completed sprints to learn from yet, the tile says so instead of showing a number. How to add it
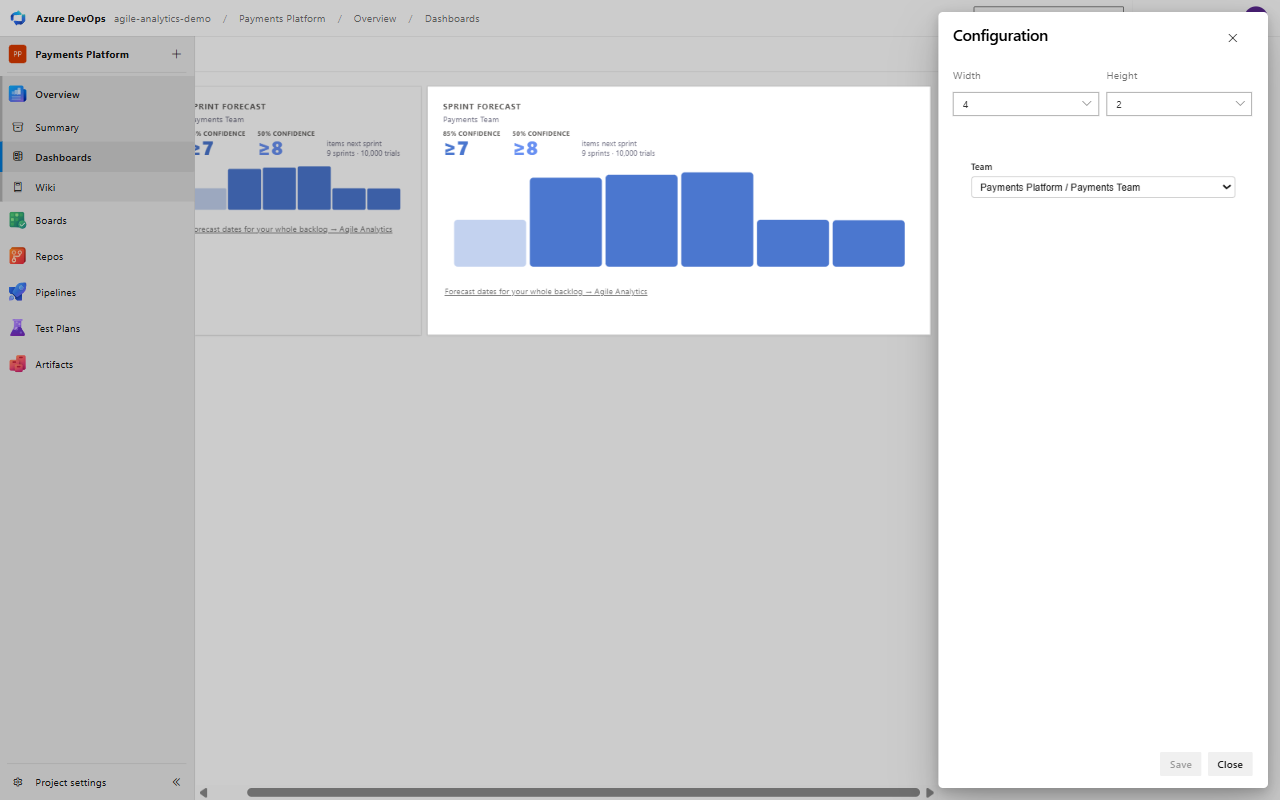
The tile supports 2x2 and 2x4 sizes and reads correctly on both the Azure DevOps light and dark themes. What it readsThe extension asks for two read-only scopes:
It does not change your work items, boards, sprints or settings. The only thing it stores is its own widget settings, kept inside your Azure DevOps organization's extension data. It runs in your browser inside Azure DevOps, and nothing is sent to Baytek. There is no account, no trial, no licence key and no sign-in to anything outside Azure DevOps. The extension makes no requests except to Azure DevOps itself. What counts as finishedAn item counts as finished when its current state name contains one of these words: Done, Closed, Completed, Resolved, Ready to release or Ready for release. The match ignores case, so "Done (Dev)" counts and "Shipped" does not. Only backlog items are counted: User Stories, Product Backlog Items, Requirements, Bugs and Research items, plus Issues in a project that uses the Basic process. Tasks, Features, Epics and custom work item types are not counted. This tile has no settings for either rule. If your team finishes work in a differently named state, the paid Agile Analytics extension lets you map your own states and work item types. If you also have Agile AnalyticsIf you have installed the paid Agile Analytics extension, this tile is separate from its Sprint Forecast tile. Each keeps its own settings and you can use either or both on the same dashboard. This tile does not read the workflow mapping or item type settings you set up in Agile Analytics. It uses the fixed rules described under "What counts as finished", so the two tiles can show different numbers for a team whose mapping differs from those rules. Want more than the next sprint?Agile Analytics forecasts dates for a whole backlog, and adds cycle time, flow metrics, DORA metrics and sprint reporting inside Azure DevOps. It has a free trial. You can find it on the Visual Studio Marketplace. Support and privacy
This extension collects no usage data. Your work item content stays in your Azure DevOps organization and in your browser while the forecast is calculated. |