LightningChart .NET
LightningChart .NET is a lightning-fast 2D and 3D data visualization SDK compatible with WinForms, WPF, and UWP.
LightningChart .NET is a charting library that is used in the most-demanding industries including science and research, vibration analysis, aerospace and defense, motorsports, industrial process monitoring, trading and finance, and more.
Utilizing CPU and memory resources efficiently, LightningChart is developed and optimized for professional high-speed software dealing with real-time data acquisition and representation. This provides an unmatched performance to deployed applications.
LightningChart is entirely GPU accelerated and performance optimized for presenting the massive amount of data, up to 1 trillion data points with 128 GB of RAM, and enables the best real-time monitoring smoothness in the industry. See performance notes.
LightningChart provides the following Features: XY charts, 3D charts, Polar view, Smith view, Maps, Signal Tools, Volume Rendering and Trading charts.
The newest version of LightningChart v.12.5.1 features enhanced LegendBox for harmonizing XY, 3D, Polar, Pie3D, and Smith views. Introducing VerticalTitlesGap for LegendBox, German and Finnish support for printing dialog windows, and more.

PROPERTIES OF FEATURES
XY
-
Series types: digital line, sampled data (discrete signal), point-line, freeform point-line, areas, high-low, polygon, stock
(OHLC candle-stick), bar, band, constant line, intensity grid, intensity mesh, line collections
- Real-time monitoring scrolling modes: scrolling, sweeping, stepping, oscilloscope
style level-triggered
- Heatmaps with contours, wireframe, contour labels
-
Stencil for rendering intensity series inside polygon, map region
-
Persistent rendering layers, Multiple legends, and Axis scale breaking
- Scale breaks to clip off unnecessary info, such as non-trading days in
weekends
3D
- Series types: surface mesh, surface grid,
waterfall, polygon, rectangle planes, mesh models, point-line, bar and pie charts.
- 3D scene settings with Multiple light sources
- Import 3D models in .obj
- Gigantic surface
sizes of over 4096x4096, depending on available memory
Trading charts
- Built-in trading data cursors
- Data loading from REST API over internet, file, or setting by code
- Built-in Technical Indicators: Moving averages, Bollinger Band, RSI, MACD etc.
- Built-in Drawing tools: Trend lines, regression lines, regression channels, Fibonacci Arcs, Fibonacci Fans, Fibonacci retracements, free-hand-annotations etc.
Volume Rendering
- Separate Linear Transfer function for every
channel
- Volume Thresholding in accordance with voxels brightness for
every channel
- Dynamic modification of Voxel range
- Manual or Automatic Adoptive sampling rate of volume data
- Three interchangeable options for Volume Rendering Ray function
Maps
- On-line tile maps: supports street maps and satellite imagery
- Dozens of maps: World, continents, specific areas
- Multi-layer: land, lakes, rivers, roads, cities etc.
- Map import from ESRI shape file data
Polar
- Unlimited, Multiple
amplitude and angle axes
-
Palette-colored point-line series
- Sectors
-
Markers
Smith
- Series types:
point-line
- Absolute and normalized scales
SignalTools:
SignalReader
SignalReader generates real-time data stream reading signal files in different formats:
WAV (PCM), sid (biosignal file), ssd (LightningChart Demo
application sample data format). The playback can be automatically restarted with looping option.
SignalGenerator
SignalGenerator is a
multi-functional signal generator component. It allows combining different waveform types into single, real-time
output signal. The waveform components can be set with a built-in user interface or by code.
AudioInput
Reads real-time sampled
data stream from sound card line-in (using e.g. microphone) through DirectSound. The data can be forwarded to
chart, AudioOutput or your own data target.
AudioOutput
Allows real-time data
stream playback via sound card line-out (using e.g. speakers) through DirectSound. The data can be fetched from
SignalGenerator, SignalReader, AudioInput or other data source.
SpectrumCalculator
Converts data between time domain and frequency domain using
Fast Fourier transform (FFT) algorithm. Optimal for calculating FFT conversion and
power spectrum of sampled signal data.
GENERAL CHARACTERISTICS
- Full mouse-interaction, touch screen support, custom mouse interactivity
extensions
- Cursors and Annotations, data colorizing with color palette, and full
customizability of components
- Data breaking by NaN or other specified
breaking value, in selected series types
- Numeric, Time, DateTime,
Logarithmic, Geographic Coordinate System (GCS) and Custom axis scales
- Professional 5-star technical support & Hundreds of chart examples
- Full compatibility with Visual Studio 2022 & .NET 6 with color
RENDERING TECHNOLOGY
- DirectX 11 & DirectX 9 support
- Automatic
software rendering with WARP in systems without graphics hardware and for virtual machines
- Selectable fonts quality
- HiDPI scaling
support
- Can be run in both 32-bit and 64-bit modes
- Controllable anti-aliasing options

For more info, visit LightningChart website and download a FREE 30-day trial!
Meet Dashtera®: a no-code data visualization platform powered by the LightningChart engine
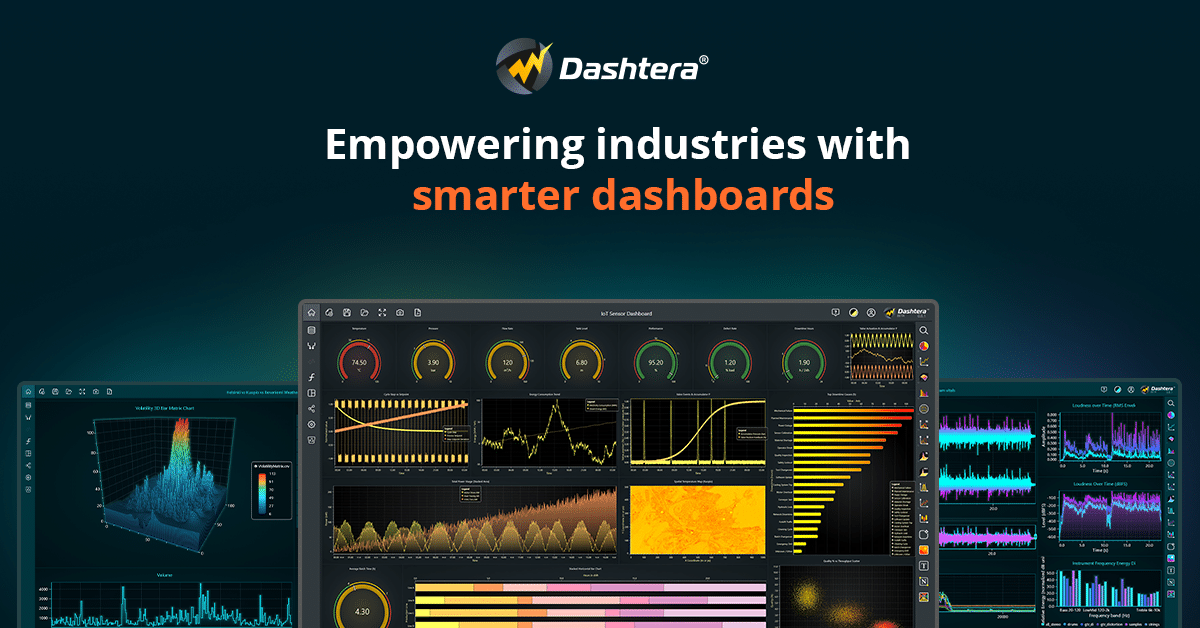
For a no-code data visualization experience, visit Dashtera®, a data visualization platform powered by the LightningChart engine featuring Business Intelligence, Engineering, Science, Finance, and Trading charts that do not require any coding.