Create a GANTT chart to:
- Visualize dependencies and critical path within your project
- Clearly see which work item has to be picked up next
- Track progress compared to the work item planning, not just based on the sum of remaining estimates
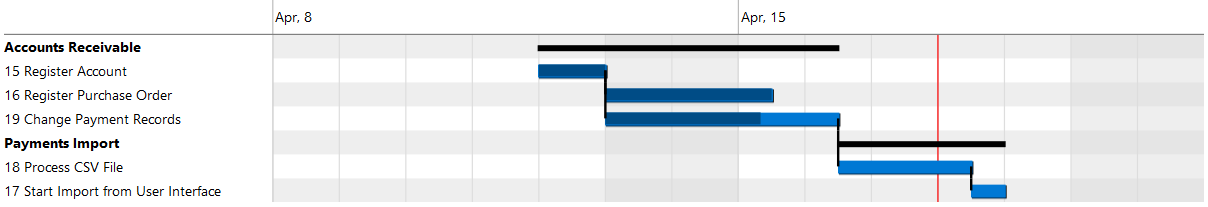
The chart shows work items and their dependencies. Also, the blue bar is shaded to indicate progress (i.e. when there is completed work). A red line shows 'today' on the chart, which can be used to see if the project is on track.
Opposed to many of the alternatives (and especially hand-crafted planning sheets), this chart shows live data. No longer work with old data, or spend time to recreate the chart.
Usage
Create a query with the work items you want to visualize. Save the query and press the GANTT tab to see the chart. Create a hierarchical query to get summary tasks.
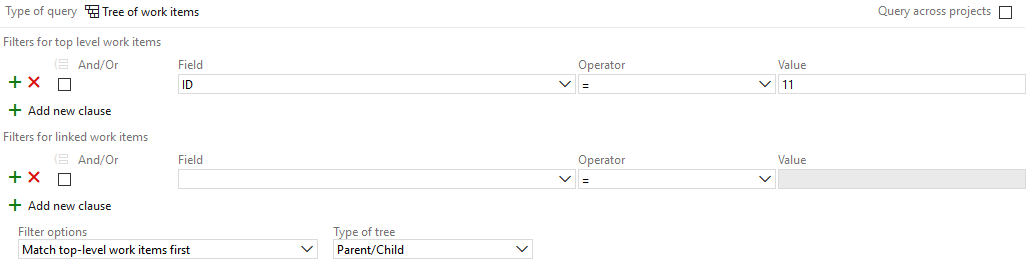
If, for example, your project consists of an epic with child items (e.g. features) and these also contain child items, you may want to create a query of type 'Tree of work items'. Select the epic and choose 'Parent/Child' as the tree type:
You can also use a query of type 'Work items and direct links'. For the linked work items, return items that have matching links of type 'child'.
Start and end dates
Items usually start when predecessors finish. Next to this, the following standard fields are used to determine the start and end dates of work items:
- Start date of iteration
- Start Date
- Completed Work
- Remaining Work
- Original Estimate
- Target Date
- Finish Date
- Closed Date
- Story Points
- Effort (Scrum and CMMI-process)
- Size (CMMI-specific)
When a start date cannot be determined, it will get the default value of tomorrow, start of business.
Limitations
Although we think the GANTT chart is a must-have for effective project management, there are some limitations:
- It is assumed that workdays run from 9:00 to 17:00 (so, 8 hours a day).
- Although team days off are supported, there is no support for days off for specific team members.
- Team size and capacity are not taken into consideration, i.e. an unlimited number of work items can be planned in parallel.
Changes August 2024
- Fix date filter
- Fix filter for 'Assigned To'
- Make predecessors and successors a link to open this item in the sidebar
- Scroll to today on load
- Show annotations in svg export
- Add calculated start, end, and target dates to extra column options
- Implement drag and drop to change start and end dates, or add a dependency
Changes May 2024
- Open work items in an overlay (using the link at the top of the sidebar)
- Resizeable columns and sidebar
- Show dashed dependency line to predecessor parent if the predecessor is hidden
- Improvements for large user lists in settings
Changes March 2024
- Fix issues in custom columns and filters
- Add Tags option to columns and color options
- Use a red diamond if target date is before finish date
Changes January 2024
- Add setting to use sort order from query results (next to the default to sort by start date and dependencies)
- Add option to scale chart to years for long-term planning
- Add setting to color work items based on hierarchy level
Changes November 2023
- Update dates and dependencies in work items from the Gantt chart view
- Refactor logic to calculate start and end dates (see manual for details)
Changes October 2021
- Add option to set scale to days, weeks, or months
- Add expand/collapse all button
Changes August 2021
- Improved sorting of work items
- Add filter options for query columns
Changes November 2020
- Add option to set work item color and/or annotation based on area/node, assignee, or project.
- Add option to show columns from query.
- Add option to pin columns and header.
- Maintain target/finish date as end date for work items with children, even if all children end sooner.
Changes September 2020
- Support team days off.
- Support team working days (instead of assuming that all teams work from Monday through Friday).
- User interface changes and show work item details in sidebar.
Changes August 2020
- Fix limitation of 200 work items.
- Add support for iterations
Changes June 2020
- Performance improvements in chart generation.
- Show more than two levels (e.g. epics, features and user stories).
- Allow collapsing work items with children (e.g. features).
- Fixes in stability and chart generation.
Changes August 2019
- Duration calculation now takes fields effort and size into consideration.
Changes July 2019
- When neither finish, closed or target date had been set, the start date was not used. This is corrected.
- Derive start, finish, closed and target dates from the parent if they are not set.
- Add velocity setting when using story points.
- Solved misalignment of date labels.

