
Agile Analytics: Monte Carlo forecasting, flow metrics and DORA for Azure DevOpsAgile Analytics is an Azure DevOps extension for teams on Azure DevOps Services (cloud). It adds a hub to every project with Monte Carlo forecasting, cycle time and flow metrics, aging work in progress, DORA metrics, sprint reporting and an Exec Report. No Power BI, no personal access token, and nothing to host. Azure DevOps Server (on-premises) is not supported. Open Azure DevOps, click Agile Analytics in a project's sidebar, and see your last 6 sprints' velocity, cycle time and a delivery forecast on one screen. AGAN AI, the helper inside the hub, checks your setup and answers "what is stuck?" with the views' own rules. Your work-item content stays in your Azure DevOps tenant. 30-day free trial, then from $300 a year per organisation. Every dashboard and report on every plan. Premium adds unlimited seats and ready-made AI commands. The trial starts on install with no credit card. See it in action
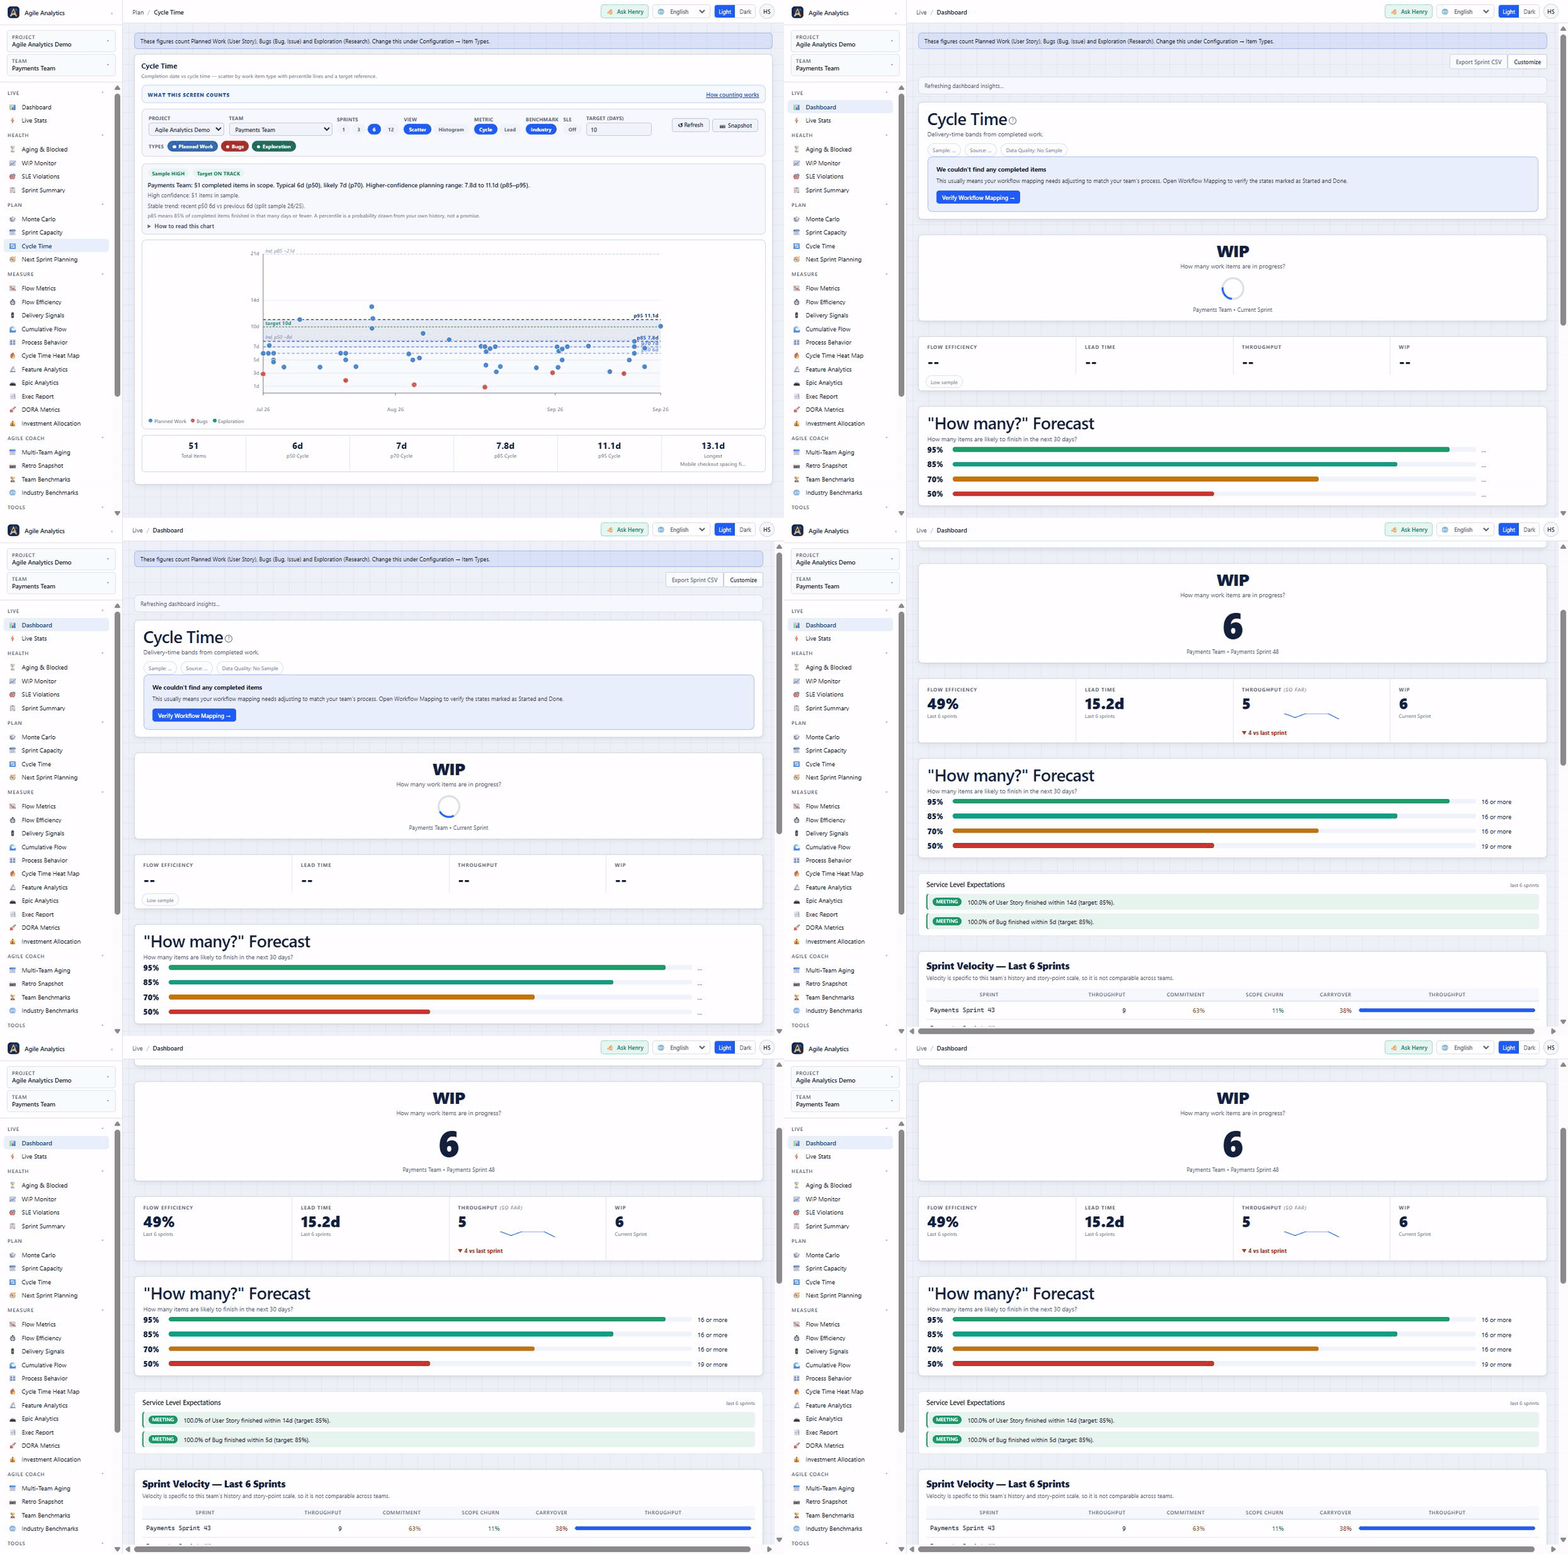
The Dashboard: cycle time bands, work in progress, flow efficiency, lead time, throughput and a 30-day "How many?" forecast on one screen.
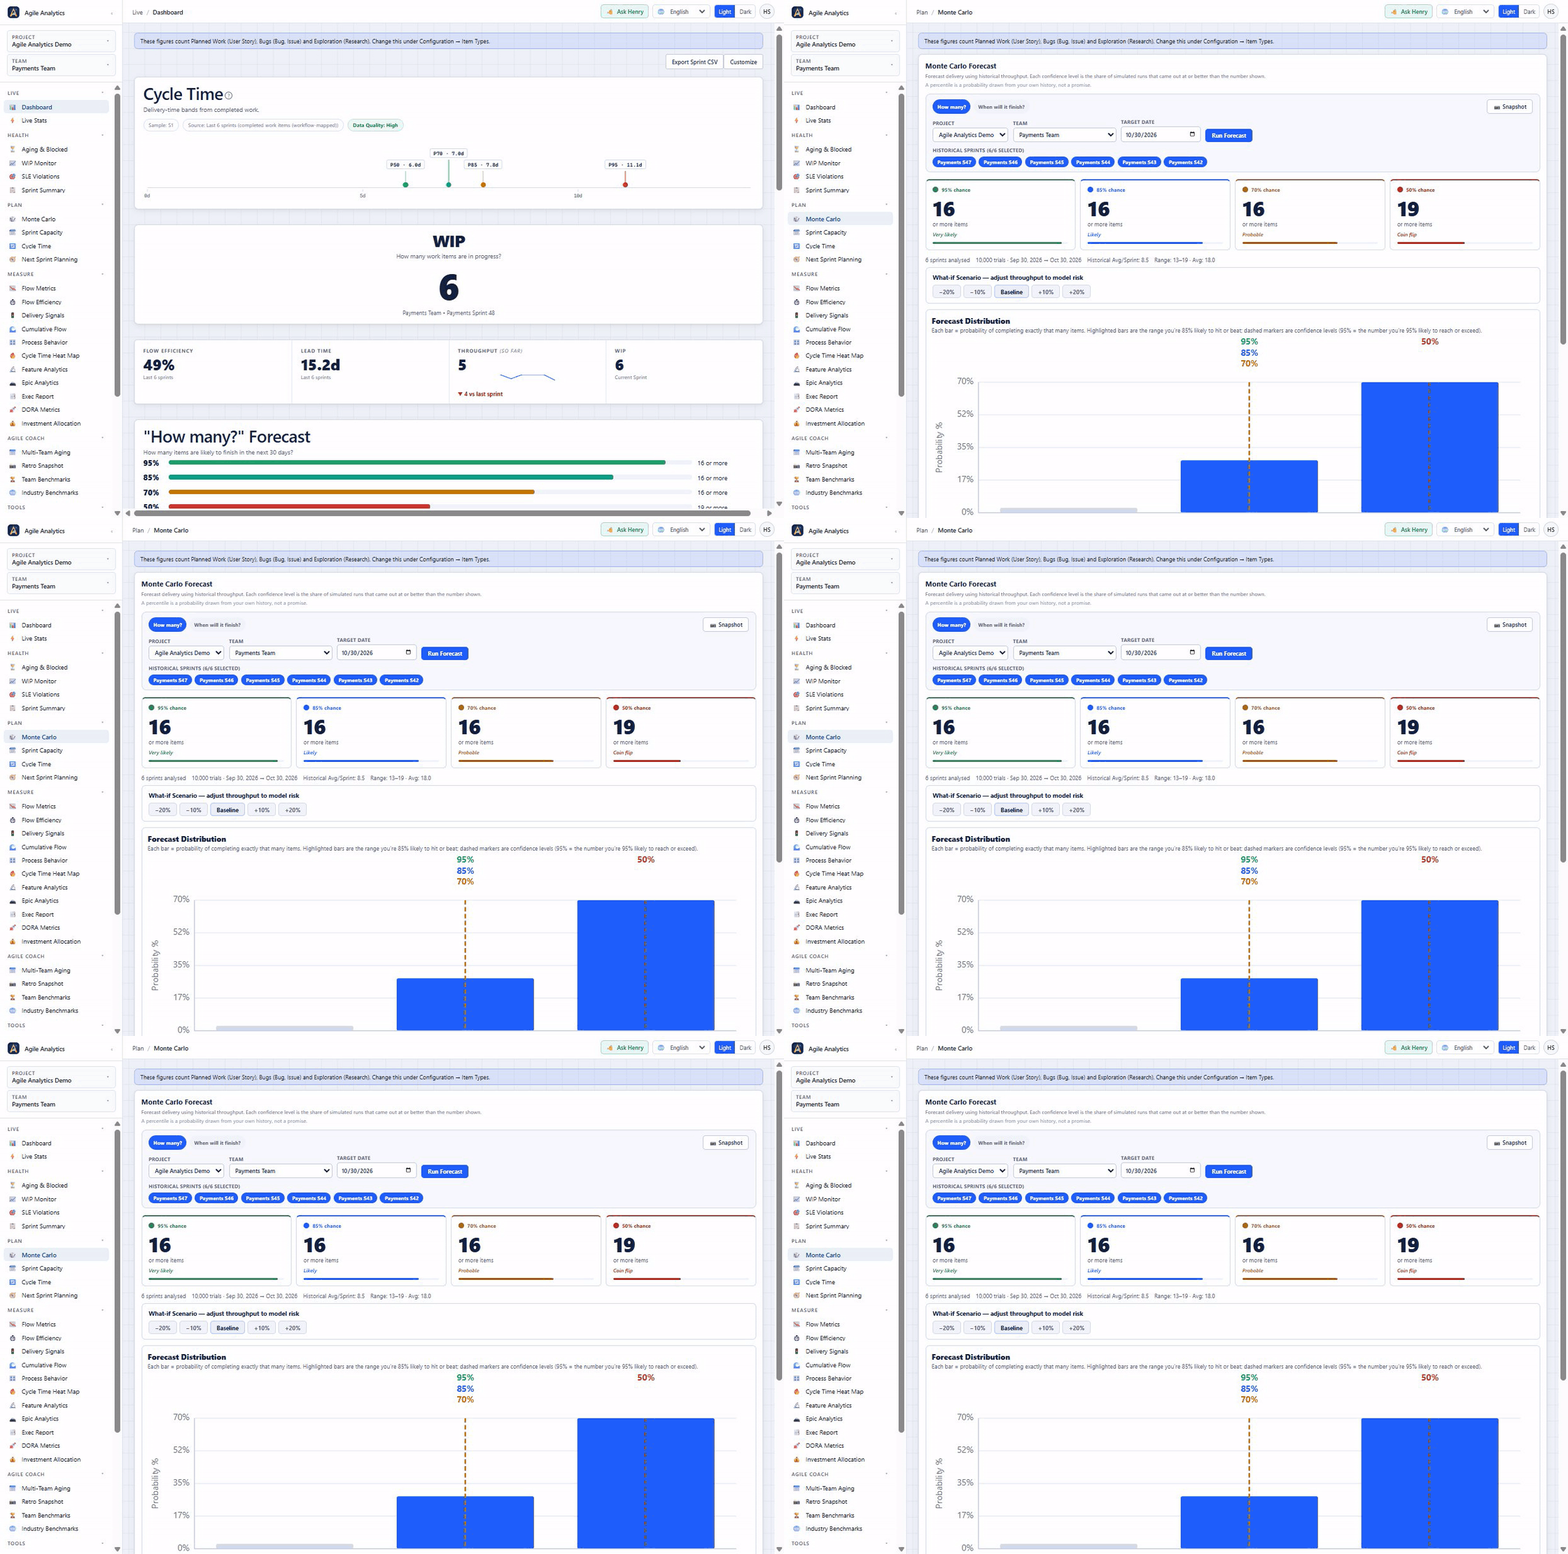
Monte Carlo forecasting: 10,000 simulations on your team's own throughput show how many items you are likely to finish by a date, at 95%, 85%, 70% and 50% confidence.
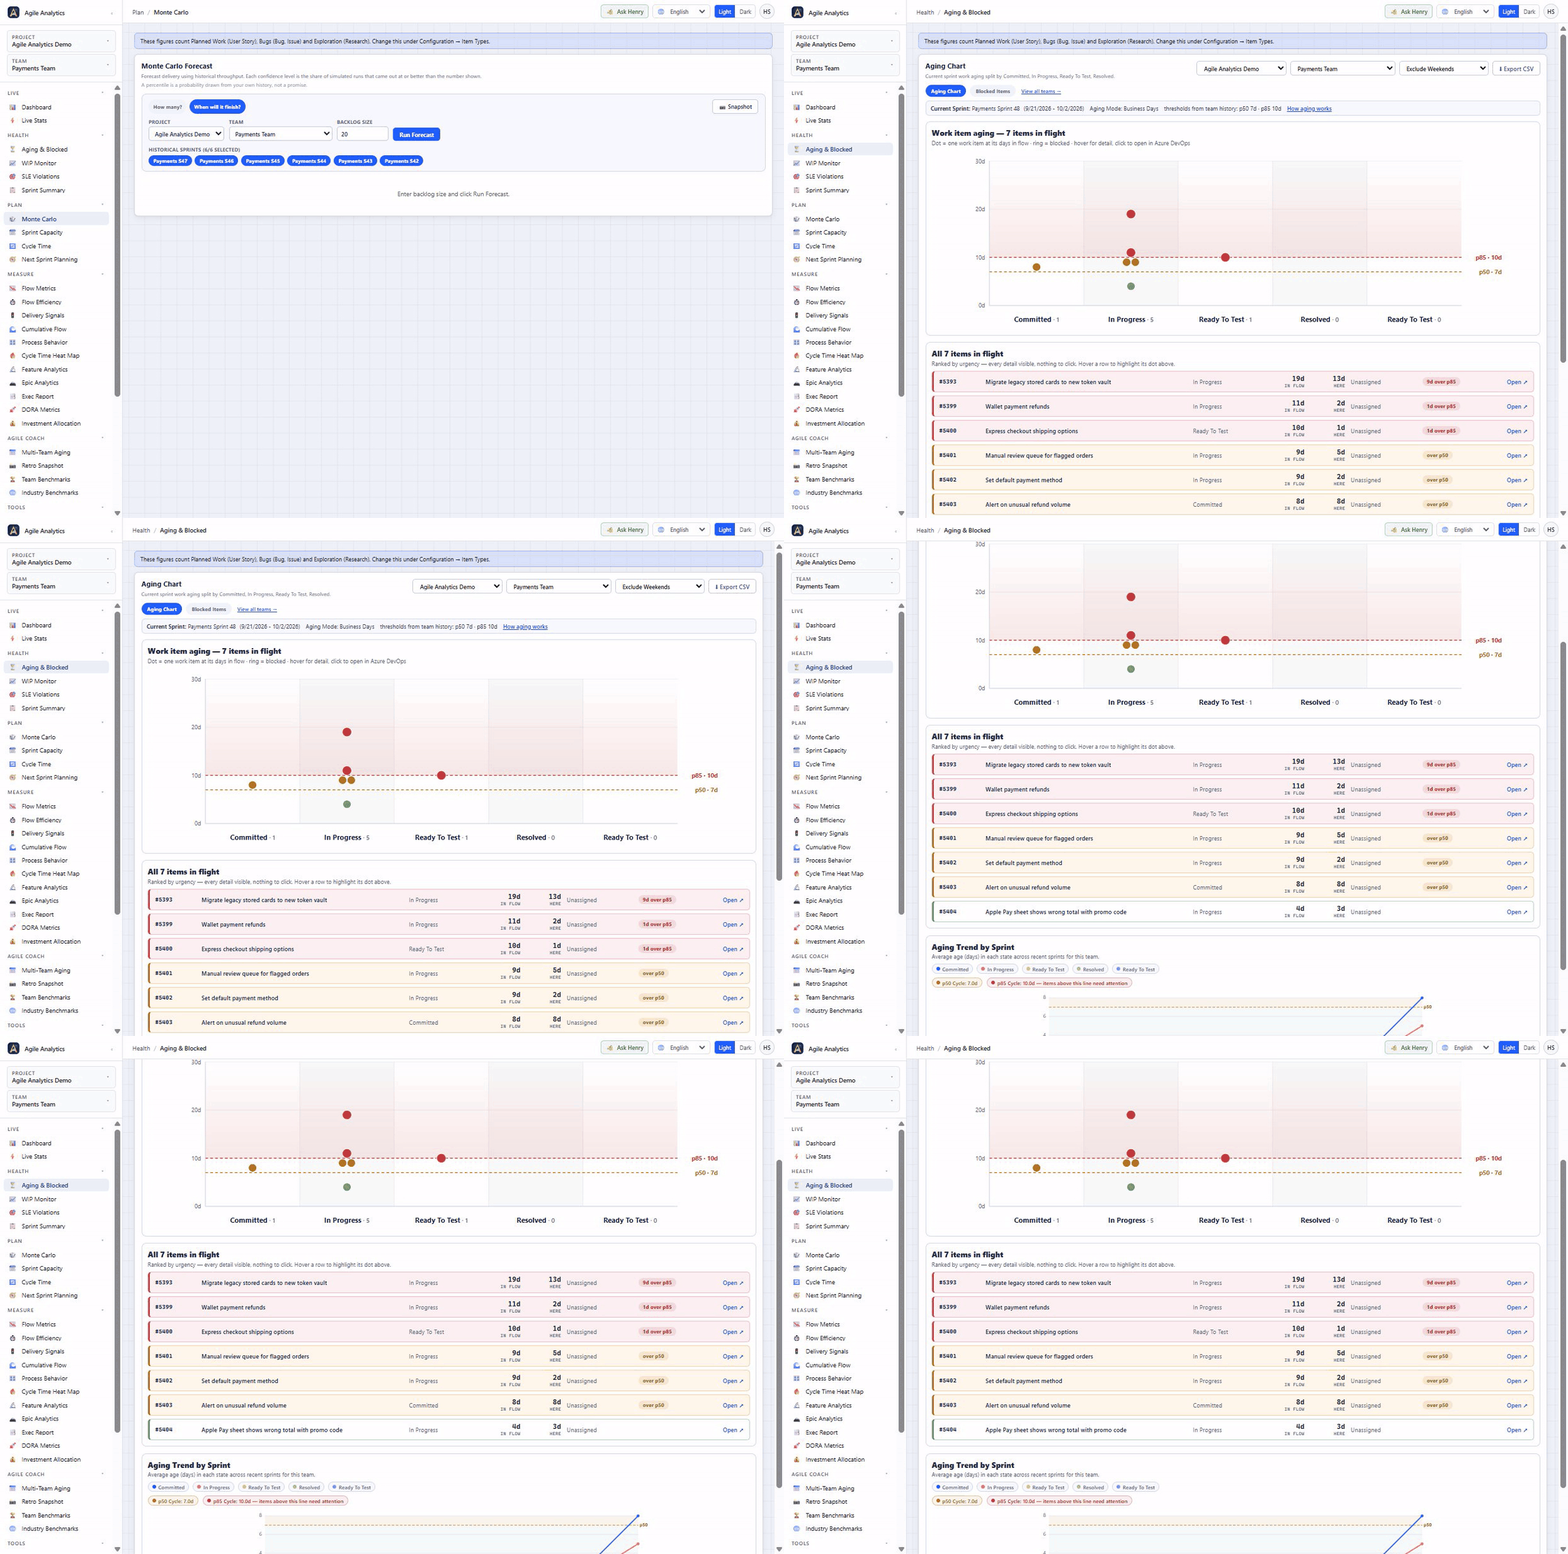
Aging work in progress: every in-flight item plotted by days in flow against your team's own p50 and p85, then ranked by urgency.
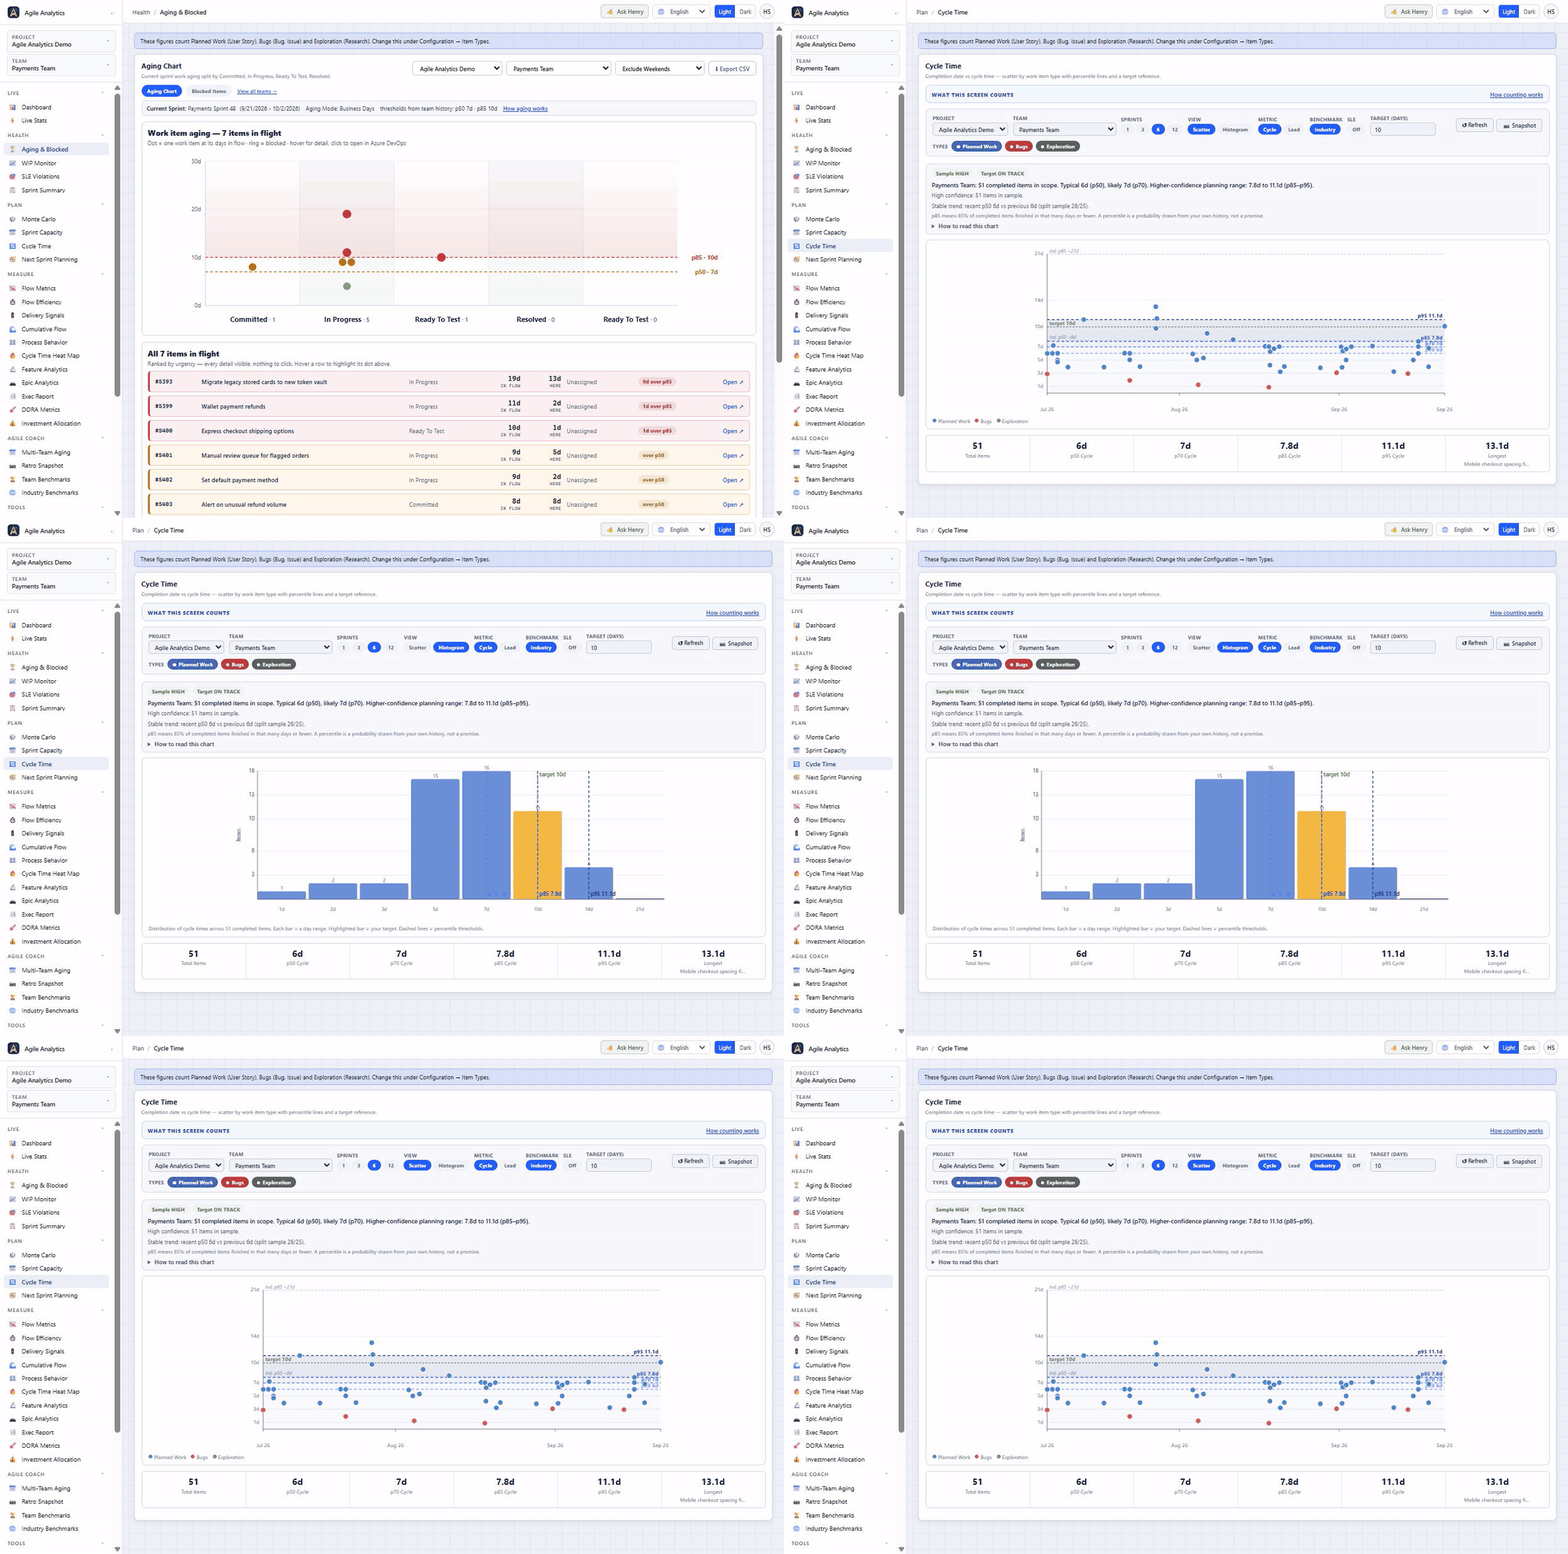
Cycle time: every completed item on a scatterplot with p50, p70, p85 and p95 lines from your own history, plus a histogram view. What you getMonte Carlo forecasting: when will we be done?10,000 simulations on your team's own throughput give P50, P85 and P95 delivery estimates, and a "How many?" forecast for a chosen date, so you can answer "when will the backlog be done" with a range instead of a guess. Teams that don't run sprints can forecast from weekly throughput instead. Cycle time and flow efficiency: how long work really takesWorkflow Mapping sets where cycle time starts and which state counts as done. The cycle time scatterplot shows every finished item with p50, p70, p85 and p95 lines from your own history, and Flow Efficiency splits each item's cycle into touch time and wait time, with the days spent in each state. Plus a cycle time heat map, lead time, throughput and Cumulative Flow, for Scrum and Kanban teams side by side. Aging work in progress and blocked itemsFind work items that have been stuck too long. Aging & Blocked plots every in-flight item by days in flow against your team's own p50 and p85, ranks them by urgency and lists blocked items. One WIP limit per team, with Teams or Slack webhook alerts. Sprint reporting without Power BICommitted vs delivered, carryover and scope change for every sprint, plus sprint burndown and velocity: Dashboard KPIs, Sprint Summary, Sprint Capacity and Next Sprint Planning, all inside Azure DevOps. The Dashboard and Sprint Summary sprint tables export to CSV. DORA metrics for Azure DevOpsDeployment frequency, lead time for changes, change failure rate and time to restore, computed from your work items and pipelines. Dashboard widgetsCompanion tiles in the widget catalog under the "Agile Analytics" category. The Sprint Forecast dashboard widget is free for every organisation, no licence needed. A one-page delivery report for leadershipThe Exec Report is a one-page delivery status report for leadership: forecast, risks, delivery trend and DORA for the teams you choose, including teams from other projects in the same organisation. Share it as a PDF, as email text to paste into your email app, or as a copied summary. It is built in your browser and nothing is sent to us. There are 30+ analytics views in a single project hub, with full dark mode. AGAN AI: setup help and answers inside the hubAGAN AI checks your setup, answers quick questions about stuck and aging work with the views' own rules, finds the right view for you, and answers typed questions about the product and your setup. Its Setup advisor prepares fixes you confirm, with Undo; organisation settings still need an Agile Analytics admin. AI answers are included in every plan with a monthly allowance per organisation. A local AI connector for your own AI assistantYour own AI assistant, such as GitHub Copilot in VS Code or Claude, gets the numbers Agile Analytics computes with your saved Workflow Mapping: a sprint summary, cycle time, flow efficiency, work in progress, aging and a forecast. The connector runs on your own computer with your own Azure DevOps access, is read-only, answers with counts, dates and work item ids only, and sends nothing to Baytek. Microsoft's Azure DevOps MCP server gives an assistant raw Azure DevOps data such as work items, and does not compute flow metrics. Included during the trial and on every paid plan, for the people who hold a seat. On Premium and during the trial it adds three ready-made commands (sprint review, stand-up and forecast), and every answer links to the matching view for that team in the extension. Install Questions it answersAzure DevOps has powerful raw data but no built-in answers for the questions that matter in sprint planning and retros:
Who it is for
Why teams choose it: no infrastructure to run (no Azure Function, no database, no service connection), WIP alerts that reach you through a Teams or Slack webhook, role-based access control with Azure DevOps directory search, and retro-ready sprint summaries in one click, and CSV, PNG and PDF exports of the numbers, built in your browser.
Your work-item data never leaves your Azure DevOps tenantEvery analytics view runs in your browser, against the Azure DevOps REST API, using your existing ADO session. Sprint contents, work-item titles, PRs, code, comments and attachments: none of it is sent to a Baytek server. Agile Analytics installs as an Azure DevOps Marketplace extension: it lives in your tenant, your admin controls it, and your security team can audit it through the Marketplace publisher record. Baytek does receive a small amount of licence, usage and operational data. The main items are under "What Baytek's backend receives" below, and our Privacy Policy lists every one. None of it is work-item content. Four read-only ADO scopes. What stays in your tenant: Azure DevOps work item content and any AI adoption credentials you enter. Baytek never sees any of this. What Baytek's backend receives: licence records (organisation name, plan, expiry, activation tokens); a lightweight install/heartbeat ping (organisation name, extension version, event type, timestamp); pseudonymous usage events (which view was opened, which feature was used, configuration completion, trial-day milestones), linked to your organisation and your Azure DevOps user GUID, never your name or email, and used to count active users and enforce seat limits (an extension admin can turn them off for the whole organisation at Configuration → Privacy); and, on Team/Business plans, who holds a seat, as opaque Azure DevOps identity descriptors and role, never names or email addresses. During the trial, the Azure DevOps sign-in email of the first organisation administrator to open the hub is recorded once per organisation, the first time they open it, and used for trial reminders and service notices, each with a one-click opt-out link. To confirm which organisation a request comes from, the extension sends a short-lived Azure DevOps access token that our server uses for one check and then discards; our licence server also records the IP address and browser of licence requests for security and rate limiting. If you opt into Industry Benchmarks, that feature's aggregate-metric data reaches Baytek too. If you send AGAN AI a question or ask it for a stakeholder summary, the question (a summary has none), the earlier messages of that conversation and a short list of counts and codes about your setup (including Setup advisor numbers such as your WIP limit, with item types and states sent by position, not name), and on the views that show them, the numbers on that view, with the same numbers for the previous sprint or period where the view holds them, reach Baytek and its AI provider, Anthropic. Never work item titles, IDs, state names or people's names. No transcript is kept; Baytek keeps only a monthly total of AI usage per organisation. An extension admin can turn AI answers off in Configuration → Access Control, and each person can use AGAN AI: On / Off in the account menu. The Exec Report is built entirely in your browser and sends nothing to Baytek. Optional integrations: when you connect GitHub Copilot for AI Metrics or set up webhook notifications, requests go from your browser directly to that source ( Accessibility: WCAG 2.1 AA achieved, checked by an axe-core regression suite that runs automatically every night against the latest code. What's New in Version 6.79v6.79.1: Use your own AI assistant with Agile Analytics (November 2026)Use your own AI assistant. "New: use your own AI" in the top bar, "Set up the local AI connector" in the Ask AI panel and "The local AI connector guide" in Help & Support open the set-up guide for the local AI connector. Your own assistant, such as GitHub Copilot in VS Code or Claude, can then ask for six Agile Analytics metrics. The connector runs on your computer, is read-only and sends nothing to Baytek. The connector follows your plan's seats. During the trial and on Premium, everyone in the organisation can use it. On Team and Business, the people who hold a seat and extension admins can. Clearer answers from the connector. When Azure DevOps is busy, it asks again and then says so, and it never works a number out from less data without saying so. A status check tells a first-time user what is missing, it can remember your organisation, project and team, and the guide has an "Add to VS Code" button. Ready-made commands on Premium. On Premium and during the trial, the connector adds three ready-made assistant commands (sprint review, stand-up and forecast), and every answer has a link that opens the matching view for that team in the extension. A shorter holiday countdown. The countdown in the top bar shows its artwork and the number of days, with the full sentence as its tooltip. Every earlier release is in the full release history. Getting started in under 2 minutes
Requirements: Azure DevOps Services (cloud), Project Contributor access or higher, and a modern browser. Azure DevOps Server (on-premises) is not supported in this version. Pricing. 30-day free trial, then from $300 a year per organisation. Every dashboard and report on every plan. Premium adds unlimited seats and ready-made AI commands. The trial activates automatically on install, with no credit card. Annual per-seat plans: Team: $300/year (2 seats), Business: $1,200/year (6 seats), Premium: $2,000/year (unlimited seats). Each licence covers one Azure DevOps organisation. See pricing. Common questionsDo I need Power BI, Analytics views or a personal access token? No. Every view reads the Azure DevOps REST API in your browser, with the session you are already signed in with. Does it work with my process? Yes: Agile, Scrum, CMMI, Basic and custom inherited processes. First-time setup reads your project's states, and Workflow Mapping under Tools → Configuration lets you check where each state belongs. Can I export sprint metrics to CSV? Yes. Sprint Summary, Flow Metrics, Delivery Signals, Cumulative Flow, Aging & Blocked, Sub-teams, the Exec Report and DORA Metrics each export a CSV, built in your browser. Can I report on several teams at once? Yes, within one Azure DevOps organisation. Sprint Summary, Sub-teams, Team Benchmarks, Multi-Team Aging and the Exec Report cover several teams, and several of them can include teams from other projects. Nothing rolls up across organisations. What counts as a seat? During the trial there are no seats: everyone in your organisation has full access. On a paid plan, your extension admin assigns seats in Configuration → Access Control and can swap them at any time. What happens when the trial ends? The trial-ended screen shows the date the trial ended and what is paused, with a field for your licence key. Nothing is deleted and your settings stay as they are; entering the key restores access at once. Admins see Buy and Need more time? Ask Henry, and team members can press "I want Agile Analytics back" so their admin sees how many people asked. The Sprint Forecast dashboard widget keeps working for free. Is there a free option? Yes. Monte Carlo Sprint Forecast is a separate, free extension that adds a next-sprint forecast tile to your dashboard, with no account, trial or licence key. Agile Analytics itself is a 30-day free trial, then from $300 a year per organisation, with every dashboard and report on every plan. Learn moreFull documentation, install guide and support live at ado-analytics.baytekdev.com. Getting Started Guide | Support & Feature Requests | Privacy Policy | Terms of Service |